Anemia questions on the USMLE routinely test whether a student can interpret a cluster of laboratory values, match those values to a recognizable physiologic pattern, and apply a stepwise workup algorithm that leads directly to the diagnosis. The challenge is not the memorization of ferritin cutoffs or reticulocyte percentages; the challenge is pattern recognition. The core test-taking skill is to translate incomplete laboratory information into physiologic meaning by asking, “What is the bone marrow doing, and why?” This article provides a full anemia evaluation algorithm focusing on the three most commonly tested etiologies: iron deficiency anemia, anemia of chronic disease (also called anemia of inflammation), and hemolytic anemia. The approach mirrors the logic used by the NBME and pairs physiologic interpretation with clinical reasoning so you can rapidly identify which labs matter most.
The algorithm always begins by classifying anemia using a combination of hemoglobin, MCV, reticulocyte count, and markers of iron status. Once these first-tier steps are completed, the path diverges toward iron deficiency, chronic inflammatory states, or hemolysis depending on the physiologic signals the body provides. On test day, this prevents second-guessing and eliminates the noise of distractors.
The most reliable USMLE strategy is to move through the algorithm in consistent sequence:
This article also integrates cognitive modeling—explaining why ferritin rises in inflammation, why LDH and indirect bilirubin signal hemolysis, and how transferrin saturation differentiates early iron deficiency from chronic disease. These concepts are essential not only for Step 1 physiology but also for Step 2 CK diagnostic reasoning.
As you proceed through this eight-section guide, each part expands knowledge: clinical pattern recognition, lab interpretation, and algorithmic organization. When appropriate, we highlight NBME traps—such as using ferritin alone to diagnose iron deficiency or misinterpreting a normal reticulocyte percentage as adequate. We also demonstrate how an adaptive QBank, like the MDSteps question bank with over 9000 items, reinforces these patterns by repeatedly pairing ferritin–TIBC combinations with their pathophysiologic logic.
Once anemia is confirmed by hemoglobin and hematocrit, the first USMLE-relevant branch point is MCV. Microcytic anemia narrows the field toward conditions that prevent adequate hemoglobin synthesis, such as iron deficiency or chronic inflammatory blockade. Normocytic anemia requires deeper thought regarding bone marrow function, inflammatory states, and hemolysis. Macrocytosis—though important—is beyond the scope of our iron deficiency–ACD–hemolysis focus.
The reticulocyte index (RI) is often the single highest-yield value in an anemia question stem. A low RI implies inadequate marrow response. This can occur when iron is absent (iron deficiency), when iron is present but inaccessible (anemia of chronic disease), or when the marrow is suppressed (aplastic processes). In contrast, a high RI—usually >2% corrected—signals increased RBC destruction or loss. This is the hallmark signal driving the algorithm toward hemolysis or acute bleeding.
Because the USMLE frequently hides the reticulocyte index in the labs section rather than the text, examinees must internalize its interpretation:
Low reticulocyte production in microcytic anemia almost always indicates iron deficiency or anemia of chronic disease. However, the test often attempts to mislead by providing mild normocytic indices while quietly implying depleted iron stores through dietary history, menstruation, or chronic NSAID use. Maintaining algorithmic discipline avoids such traps.
Below is a compact table summarizing the classification logic used for the remainder of the algorithm.
The most important part of the anemia workup algorithm centers on interpreting iron studies. Iron deficiency and anemia of chronic disease may both present with low serum iron, but the underlying physiology—and thus the lab pattern—is fundamentally different. Iron deficiency represents a supply problem; anemia of chronic disease represents a sequestration problem mediated by inflammatory cytokines such as IL-6 and hepcidin.
Iron Deficiency Anemia (IDA) displays:
Anemia of Chronic Disease (ACD) demonstrates the opposite physiologic pattern:
USMLE traps commonly arise from students over-relying on ferritin alone. Ferritin is an acute-phase reactant and will rise with infection, chronic inflammatory disease, malignancy, and obesity. Therefore low ferritin is diagnostic of iron deficiency, but “normal ferritin” never rules it out in inflammatory states. The correct move is to evaluate the full panel: ferritin, TIBC, and transferrin saturation.
Another NBME pattern: Early iron deficiency can appear normocytic because MCV drops only after prolonged depletion. Therefore a patient with heavy menses, low transferrin saturation, and borderline ferritin still fits IDA even before MCV falls below 80.
The MDSteps Adaptive QBank repeatedly drills these patterns by presenting stem variations: normal ferritin with inflammation, isolated low transferrin saturation, or elevated ferritin with malignancy. Practicing these variants strengthens recognition under exam pressure.
Turn this concept into NBME-style question practice with signal-first explanations, why-wrong logic, and weak-pattern review.
Once a high reticulocyte index is observed, hemolysis becomes the dominant concern. The next step in the anemia workup algorithm is identifying hemolytic patterns using three central markers: LDH, indirect bilirubin, and haptoglobin.
Hemolysis Lab Pattern
These markers are highly reliable because the physiology is straightforward. RBC destruction releases intracellular LDH and hemoglobin. Heme degradation increases indirect bilirubin. Free hemoglobin binds to haptoglobin, lowering its measurable level. When all three signals align with a high reticulocyte count, hemolysis is nearly certain.
Distinguishing intrinsic vs extrinsic hemolysis is another common USMLE test. Intrinsic etiologies include membrane defects (hereditary spherocytosis), enzyme deficiencies (G6PD), and hemoglobinopathies (sickle cell). Extrinsic etiologies include mechanical destruction (prosthetic valves), autoimmune hemolytic anemia, and microangiopathic processes (DIC, TTP, HUS).
Although Step 3 is not the focus of this article, board-style reasoning for hemolysis always returns to the algorithm: identify destruction, determine mechanism, then identify specific cause. This hierarchical construction is essential for exam accuracy.
This section consolidates the algorithmic approach into a single interpretive sequence. The USMLE frequently embeds multiple incomplete clues in the question stem, requiring examinees to deliberately walk through the anemia workup rather than leap to diagnostic closure.
Algorithm Summary
Flowchart-style reasoning eliminates extraneous data and aligns with NBME logic. Many students incorrectly jump to diagnoses after seeing a single abnormal value. Algorithmic discipline prevents this error. For example, low serum iron could be IDA or ACD; only ferritin and TIBC clarify the difference. A high reticulocyte count could reflect blood loss rather than hemolysis; destruction markers differentiate the two.
Below is a minimalistic verbal flowchart:
Students benefit greatly from practicing these branches in timed conditions. MDSteps analytics tools allow users to review error trends, isolate misunderstandings in iron study interpretation, and generate automated flashcards for repeat weak points—an important reinforcement technique for high-yield lab interpretation.
Even with a structured algorithm, poorly designed heuristics can sabotage reasoning. This section highlights traps commonly used in NBME-style questions and provides strategies to avoid them.
The correct strategy is to follow the algorithm strictly. When the stem is ambiguous, prioritize labs that reflect physiology: ferritin for storage, TIBC for transport, LDH/haptoglobin for destruction. Avoid over-interpreting symptoms. Many anemia stems include fatigue, pallor, or dyspnea, which carry no discriminative power. Algorithmic lab interpretation remains the anchor.
Vignette cues can guide you toward a working hypothesis, but labs must still close the diagnosis. This section outlines classic associations:
Iron Deficiency
Anemia of Chronic Disease
Hemolysis
Using vignette cues to generate an initial hypothesis improves efficiency, but the diagnosis must follow directly from the algorithm and pattern recognition.
Try the MDSteps Adaptive QBank to reinforce these anemia algorithms through spaced repetition, timed vignettes, and automated Anki-exportable flashcards that strengthen pattern recognition across multiple question variants.
Medically reviewed by: Jonathan Reyes, MDWhy a Structured Anemia Algorithm Matters on the USMLE
Step 1: Classifying Anemia by MCV and Reticulocyte Response
Parameter
Implication
MCV low
Iron deficiency or ACD likely
MCV normal
ACD vs hemolysis vs acute blood loss
Reticulocyte Index low
Marrow underproduction
Reticulocyte Index high
RBC destruction (hemolysis)
Step 2: Iron Studies—The Critical Split Between Iron Deficiency and ACD
Practice this topic the way USMLE tests it
Reading the topic is only step one.
See how it works
Step 3: Recognizing Hemolysis Through Destruction Markers
Step 4: Putting It All Together—The Full USMLE Anemia Algorithm
Step 5: Common USMLE Traps and How to Avoid Them
Reality: Ferritin increases during inflammation. Always check TIBC and transferrin saturation.
Reality: Percentage must be corrected. In severe anemia, a “normal” percentage represents inadequate response.
Reality: Early IDA remains normocytic.
Reality: Elevated bilirubin requires LDH and low haptoglobin for confirmation.Clinical Vignette Patterns That Signal Each Etiology
Chronic blood loss (menorrhagia, GI bleeding), poor dietary iron intake, post-gastrectomy states. Look for pica, brittle nails, or restless legs. On the exam, a 24-year-old woman with heavy menses and low transferrin saturation should push you toward IDA even before MCV drops.
Chronic infection, autoimmune disease, malignancy, CKD. Ferritin is normal or elevated, and TIBC is reduced due to inflammatory suppression of transferrin. The NBME often includes subtle cues like rheumatoid arthritis, IBD, or metastatic cancer.
Jaundice, dark urine, back pain, splenomegaly, or exposure to oxidant drugs in G6PD deficiency. Laboratory patterns are definitive: elevated LDH and indirect bilirubin, low haptoglobin, and high reticulocyte count.
Rapid-Review Checklist for Exam Day
References
Algorithms & Diagnostics
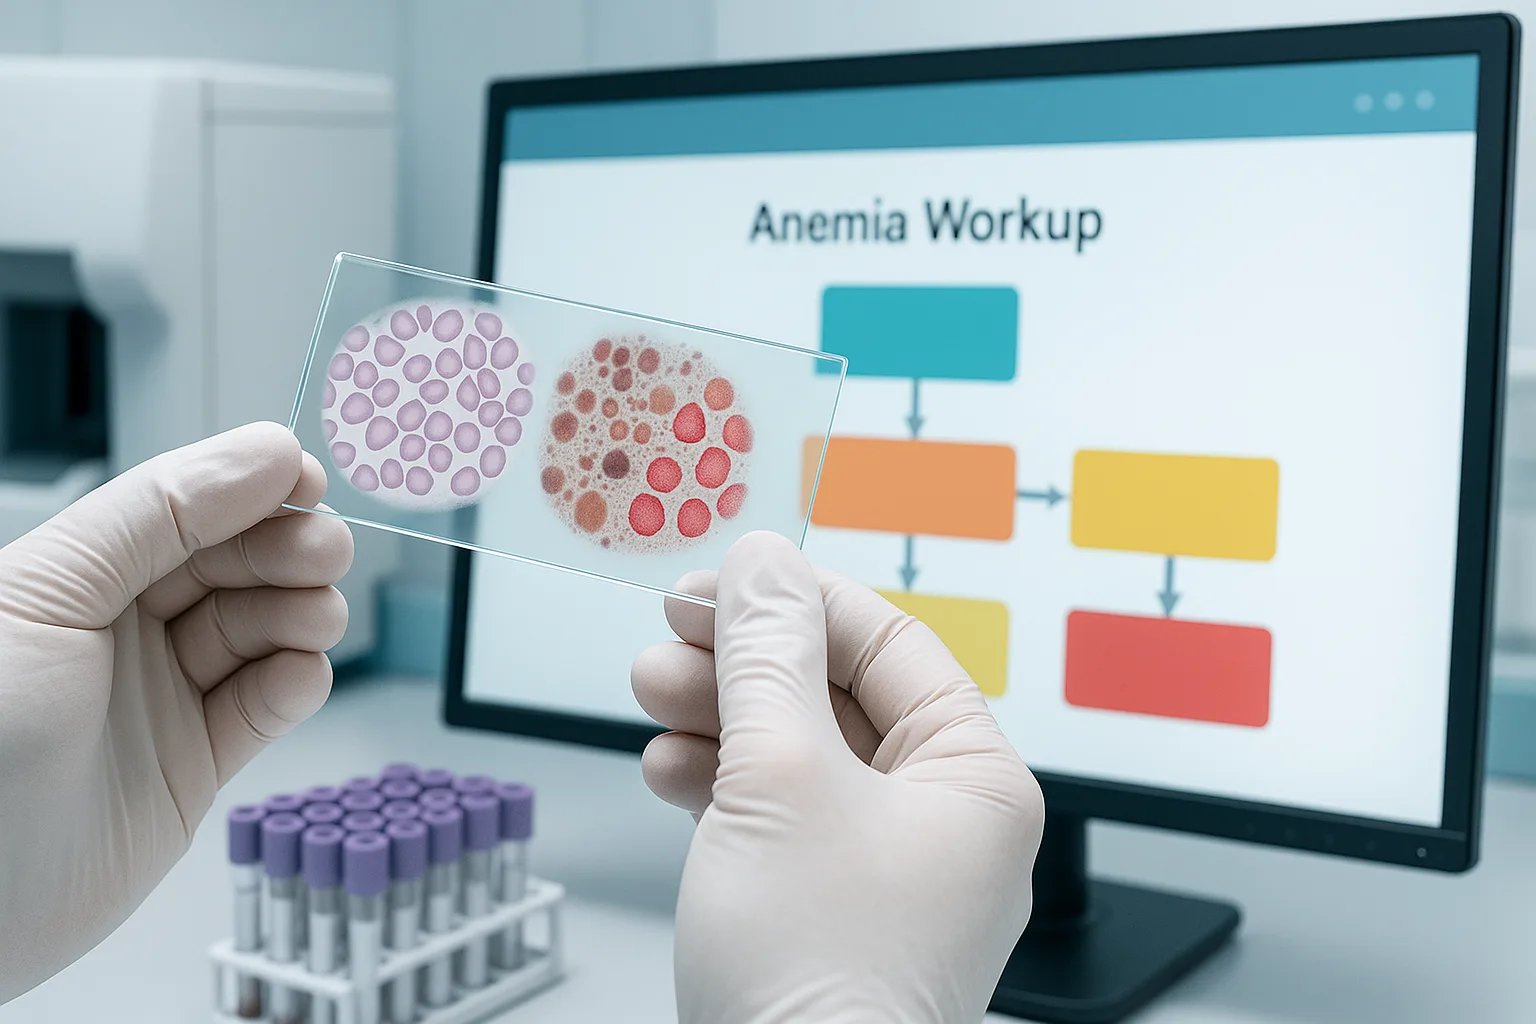
Anemia Workup Algorithm for USMLE: Distinguishing Iron Deficiency, ACD, and Hemolysis.
Full access: $27/mo
Lifetime: $299
Topic-targeted blocksSignal-first explanationsWhy-wrong review
Monthly access. Cancel anytime. No free trial required.
Topic practice